BSA – ComLink


This is the actual ComLink symbol with CP’s added. This component have an Auto-option allowing it to automatically open as the application start and stay open. This is often the preferred way of handling communication links in automation systems. To use this component for Modbus you need to add one or more ModbusTable and a Select or Update. The Select/Update take both ComLink and Data Table/Modbus Table as input, so no diagram wiring is needed. The optional CP (Connection Point) is for you to manually control the component or respond on events in the ComLink.

The term Link here might be a bit confusing because we use the terminology to describe the line connecting symbols, but in this case we also use the ISO link as “ComLink) to describe a communication transport between two endpoints.

The symbols here are shown with horisontal CP location – input at left and output at right. That can be switched to top-down as you please. the same with colors – the blue color is the default. The content of the symbols is default communication parameters, but can be changed to contain description. I am very happy with the resault in this case. The gray label on top show the unique name, box content connection details – the result is a very readable component & diagram.

This is a more advanced example where I connect to four ComLink’s manually and use a sub-diagram to maintain a combined state. This also show a detail with crossing links that I need to add on the todo list. If lines are crossing they might be difficult to read, so I am thinking of doing something on either vertical or horisontal lines automatically – but that’s for later.

For consistency I consider adding CP’s everywhere – not sure – in this case you have ComLink with fixed CP’s, while the other components with free connections – which means they need to specify event/method manually – the later add a bit of work, so it might be faster to design/code if I only use fixed CP’s because you then select event/method as you connect.

Another concern here is that Close and Open do an automatic Fork. Open have one output signal so that is automatically connected, but how do I process Open to four different components? A Fork will allow you to control the details, while here I end up executing the four Open operations in random order (the same order you designed links in). I think this is ok, but I need to think about the details and how this will be a bit. The difference with a Fork is that I can execute parallelism as well – force the system to execute the operations in parallell which in this case could be an advantage over a random, sequensial approach.

It’s a few details in the coming here because I need to consider how this works out for the developer – how fast is it to work with.


BSA – Connection Points

ComLink is as the name indicate a component that contain a communication link (IPC, Serial, Ethernet) and contain two Methods : Open and Close. In this case both are optional because the component also have an auto “AlwaysConnected” mode. The output is either OnOpen, OnClose or OnError. OnOpen is shown red because it is Mandatory and not connected. OnClose is shown Green, Open because it is Optional and not connected. OnError is shown Green because it is connected.

Some components will have a fixed list of input/output signals as in this case. The positon of the communication points are computed automatically and the object is sized if needed.

BSA – Multiuser/Team Support

These days we tend to work as a team through GIT or similar tools, but assuming two engineers work together on a project it would be nice to chat and see what the other is doing real-time. This feature is a bit in the future, but I like to think and plan ahead on issues I know would be a significant booster.

And yes – we do have chat options on separate tools and options to share screens on Teams or similar, but I want to look into the benefits of integrating them into the tool for the purpose of increasing productivity.

One issue is that it sometimes is nice to have closed discussions with other users, other times you enjoy chatting in a subject group – or maybe you just missed a few days at work and want to see what the others have been up to – reading up on public discussions. Also – sometimes you need to ask questions that someone picks up in a different timeline. None of this is rocket science today, but again – I want to experiment with the added value of having it in the tool.

I will leave this subject for now as I firstly need the stand-alone BSA functional. But, the idea is not that difficult to implement using a decent database as a repository server.

And Yes – I understand that some developers like privacy and be able to avoid that managers or others oversee to much, so I will support a privacy/off-line mode regardless. But, having chats and multiuser support in the tools is also about socializing with others. Often you are not involved in a project and would like an insight or maybe jump into someone elses work and copy parts of it to save some hours. BSA needs to be fun to work with!

BSA – Notes

Notes or comments are very usefully in any programming language, but they are often left out in graphical tools. BSA will add manual- and  auto- created notes. Manual Notes are Cyan by default and maintained manually as part of the diagram. The example above shows a mock-up diagram with possible notes at right. I need to experiment with colors, but those can be changed by user anyway. As BSA Compile a project it will also generate Warnings and Errors as any other compiler – these can be added to the diagram as auto-generated notes, meaning they dissapear with next compilation (or if they are switched off).

I will need a global Error/Warning list as well, but, in a graphical tool it makes a lot of sence visualizing these in the diagram as shown above. At the end of the day this is a comment added by yourself or BSA to assist you in you job, but this is smething I often miss in other tools.

The examples above lack an optional, dotted link to “State” – Auto-generated Error/Warning will need this to pin-point what object that cause the issue. And as mentioned you can remove all auto-generated stuff with a click – this is also important because sometimes you simply want to draw illustrations and not worry about executable details yet.

BSA – Showing Parameters

Showing to different Start terminals with parameters. The result is ok and I lack a better idea. In this case I list the parameters below or right just to visualize them in the diagram. I need to add default settings here because parameters of “MyToplabel” need to have values if “MyLeftLabel” is used and vice versa. This also means that parameter names are unique for the diagram and treated as local variables.

In this example  add local variables. “Locals” is a reserved name using a Data Table to hold local diagram variables. I might have to adjust the details a little, but I thing this will work just fine. To be honest I often add visualization like this and then I just need to use it for some time to make up my mind if it does the job or not.

BSA – Real-Time Plot – part 1

It’s ca 25 years ago that I designed my first real-time plot that was a very advanced multi-plot showing a high number of sensors. I have used several plots since then, but I want to create something that is very powerfully for BSA that fullfill two requirements – (1) fast and easy to use and (2) capable of the same complexity as advanced multi-plots.

To achieve this I will need to create a set of tools in BSA that used stand-alone is not so impressive, but used together they are very capable.

#1 – Standard RT Plot with everything on. This is to make it dead easy to display a few plot-lines and is only a composition of the other tools.

#2 – a plot line stand-alone with or without a background. If you add multiple of these on top of eachother with transparent background you get a very interesting plot.

#3 – a stand alone Legend that you can put and format independently.

#4 – a stand-alone X and Y axis so you can add multiple of both to form a multi-plot.

Stay tuned – I will demonstrate this in a few days because using BSA as base this is not difficult or time-consuming at all.

BSA – Autogenerating BSA Content

This example show a classic ER-Diagram and how to auto-generate part of an application based on that diagram. This example is actually my own Tool Maker that I use to maintain tools and properties in BSA itself. It is not auto-generated yet, but i could be and this is one of the features that I will implement in BSA. In this case we will be using BSA to auto-generate content we can change in BSA.

This little diagram illustrate three tables Component->Property->Value. This is all text as the previous GUI was Excel. But, if this had been drawn in BSA as above I could easily have autogenerated Forms to edit those three tables. Auto-generating GUI means you need to follow some standard scrheme and the GUI you generate will be a copy of that.

This dialog is an example of a component grid. If I double click on any row I will edit the details row for this.

This next dialog show the Tool Details with list of properties and details I want to view. I now use a banner & grid on top to edit details of each component and list the components properties in a grid below. Next drilldown will be the property editor. This is not exactly rocket science, but making this manually was about 6 hours of work. My forst editor was Excel, but I decided I wanted a proper editor for this. If you have a lot of tables it is quite handy to have a first auto-generated GUI just a click away – ok it was only 6 hours with WPF, but it would have been far more with QML – and 6 hours saved is 6 hours saved – if you don’t like the layout simply change it.

BSA – Select

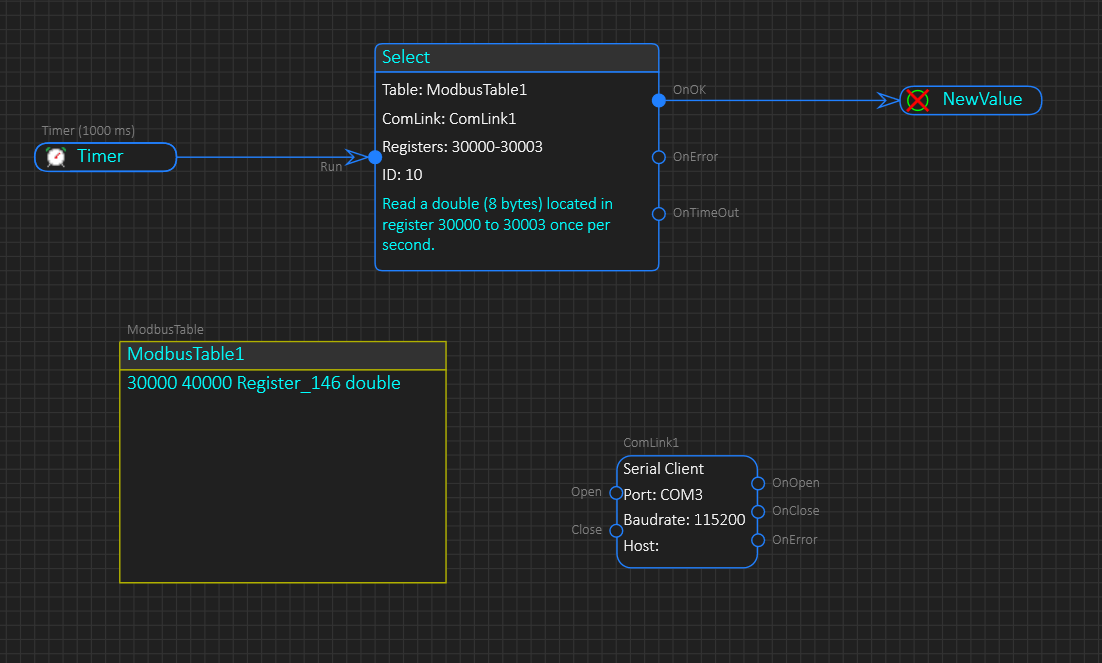
This is a mind experiment. The select operation will need to specify which table it shall read, and in this example I just drew the Modbus Table and used a relation between the select statement and the table. I am not sure if I want to allow this, but it is an option. Tables can be displayed several places, so ModbudTable1 can be defined in another diagram and only referenced here. What this should do is to call select – which in this case execute a read that read 30000 to 30002 every second. And once we get a responce we trigger the “GotData” event.

Using a relation like this is a bit misuse of the technique, but it is an interesting idea that actually add readability to the code – ok, we can change the line type to avoid confusion, but this diagram is actually readable and it makes it very visible what we are doing.

ModbusTable is an abstracted Modbus interface that allows you to view Modbus as a table with continious registers – what you see is Input (Read) and Holding(Write). This will only support a small subset of Modbus so we will need an adition Full Modbus version, but this abstraction takes care of 99% of usage + it makes it easy to map registers to variables inside BSA.

“ModbusTable1” is a specification that is implemented as a read/write modbus message and an internal cash table. The rest of the system will see this as a datatable accessing registers by name. I need to do a bit adaption as I test here, but I think I prefer to use Select rather than a specialized Read in this case simply to avoid to many statemenst doing similar things.

BSA – Failure of the week

I quickly tested using my mini-editor to edit source code and this is a mistake. The idea in this case is that you write a statement block – a small script in PScript that execute a small operation – this is intended for assign operations, but you can write a full PScript program if you want. It looks ok – you can switch between showing the actual code or just description, but the editor was bad – very bad in this case. It will kind-of work, but I need a better solution here.

One idea is to let the user double-click and open a full editor, but in this case we need a proper source code editor. I have two of these components – Assign was intended for a more Table/Tree like list of actions, while “Source Code” was intended for the example shown above. I am very unsure about the table/tree alike concept as I need to convince myself that it will add something – I think I will focus on getting sniplets of source code directly in for now – and here is the upside – I can actually let the user enter whatever source code he/she wants to use.

PScript (or Plain) is target generic and a good starting point. This will go hand in hand with PLD, but why not let the user input Python, C/C++, C#, Java or whatever is needed? Yes it add some difficulty because I need to cover usage of multiple target languages on a target, but it is doable. Python is a simple example as we can just run Python scripts from just about anywhere, but I need to add a Python API – it will be a bit of work. I think letting the user choose between PScript, Python or target language will be ok – target language for the platform and PScript is a minimum and then adding Python to those targets supporting it?

PScript is more forward because the compiler will convert PScript to target language – I don’t actually plan to use a PScript Engine.

But, editors – I need to integrate a proper source code editor… I will return to the API needed for target languages later…

BSA Compiler

This figure illustrate the work flow of the code generator that I decided to call “BSA Compiler”. The BSA Compiler will read the project file and compile the output source code that can be used by a standard IDE/Compiler to compile/link the target executable. The BSA Compiler will also verify project content because a lot of the content is loose text or drawings that the compiler will issue errors or warnings about. I am consider a JIT (Just In Time) style compiler so that I get tags of errors and warnings continiously as I work in BSA. If you draft functionality on high level you might not care about executable details yet – but the compiler will force you to deal with them before you generate target source code.